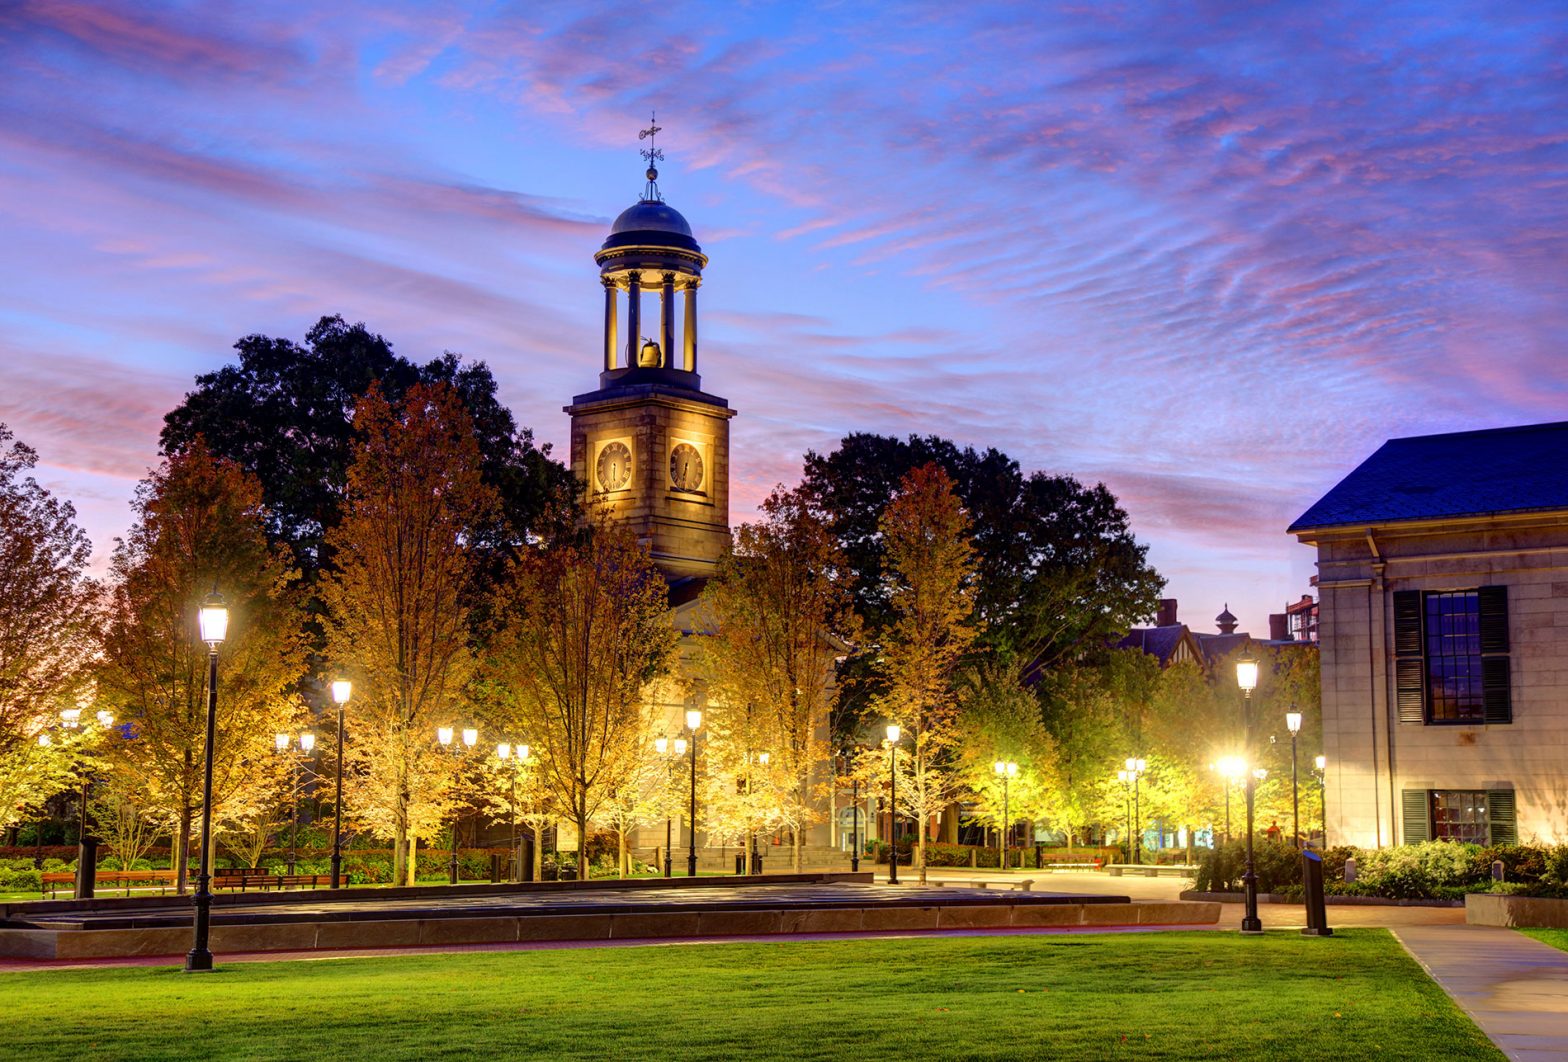
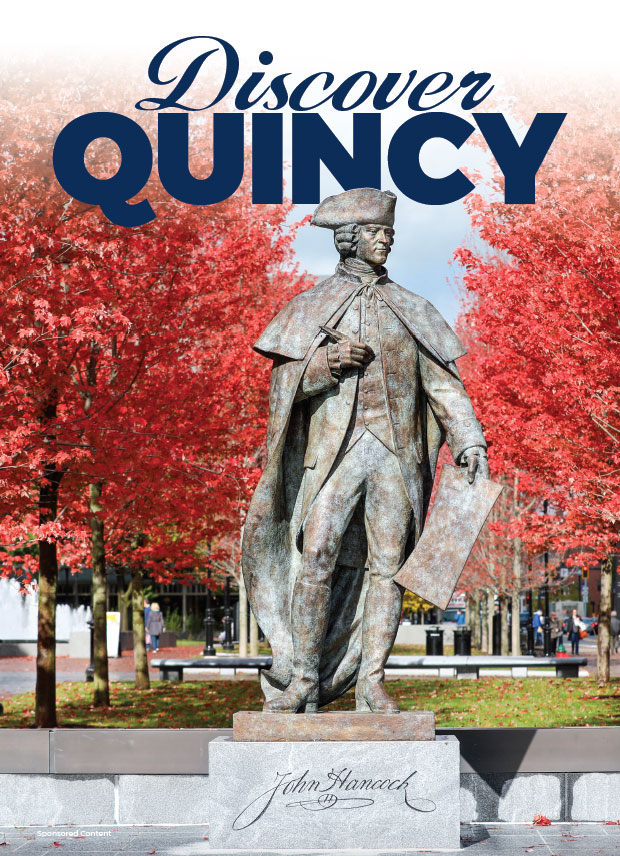
Quincy, MA
If you want to live near Boston, but long to have a dash of small-town living to go with your big-city amenities, then Quincy, MA, may be the place for you.
Nestled just south of Bean Town, Quincy boasts an outstanding quality of life and a diverse economy that features key sectors such as education, manufacturing, health care and technology. The city is also a part of the new Life Sciences Corridor.
Here, you can fill your evenings and weekends with great outdoor activities and a thriving entertainment and nightlife scene. And history buffs will also enjoy exploring this area known as the “City of Presidents.”
If you’re thinking about moving to Quincy, MA, be sure to check out the new edition of Livability Quincy, Massachusetts magazine to discover everything you need to know about living and working here.
Quincy, Massachusetts Businesses & Brands to Know

Weather in Quincy, MA
Average Temperatures
60 High / 42 Low
Average Annual Rainfall
50 Inches
Average Annual Snowfall
51 Inches
Quick Facts about Quincy, Massachusetts
- Median Home Value
- $547,066
- Median Property Tax
- $3,227
- Total Population
- 102,775
- Average Commute
- 29 min
- Median Household Income
- $105,102
- Median Rent per Month
- $1,706
Map of Quincy, MA
Experiences & Adventures in Quincy, MA

Get Out and About in Quincy, MA
There are big ways to explore the outdoors in the small town of Quincy.

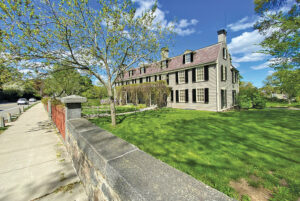
Happy Trails: Explore Quincy, MA’s Presidents Trail
Quincy's Presidents Trail highlights the town's unique place in American history.
Food Scenes in Quincy, MA

Eat Your Way Around Quincy, MA
Quincy's dining and entertainment landscape shine with culinary and musical superstars.
Quincy, MA: Where to Live Now

Best Places To Live in Massachusetts
This New England state is rich in American history, but the best places to live in Massachusetts are also modern and diverse, with a youthful vibe.
Education, Careers and Opportunity in Quincy, MA

Report Card: Quincy, MA, Schools Take Top Scores
Quincy schools create a welcoming and inclusive academic community.

Quincy, MA Helps Startups Fuel Themselves for the Future
Resources in Quincy help startups grow and innovate.
Quincy, MA Top Employers
Quincy, MA, may be known for being in the business of producing political greats, but this thriving city is a central hub for several industries.
Quincy, MA: Love Where You Live

Quincy’s Downtown Rebound
New development projects around downtown bring together the old and new.

6 Reasons to Call Quincy, Massachusetts, Home
Looking to move to the City of Presidents? Here's why you should call Quincy, MA, home.